확장 칼만 필터 위치추정 Extended Kalman Filter Localization
이번에는 확장 칼만필터를 이용한 센서 퓨전 위치 추정 방법에 대해 살펴보겠습니다.
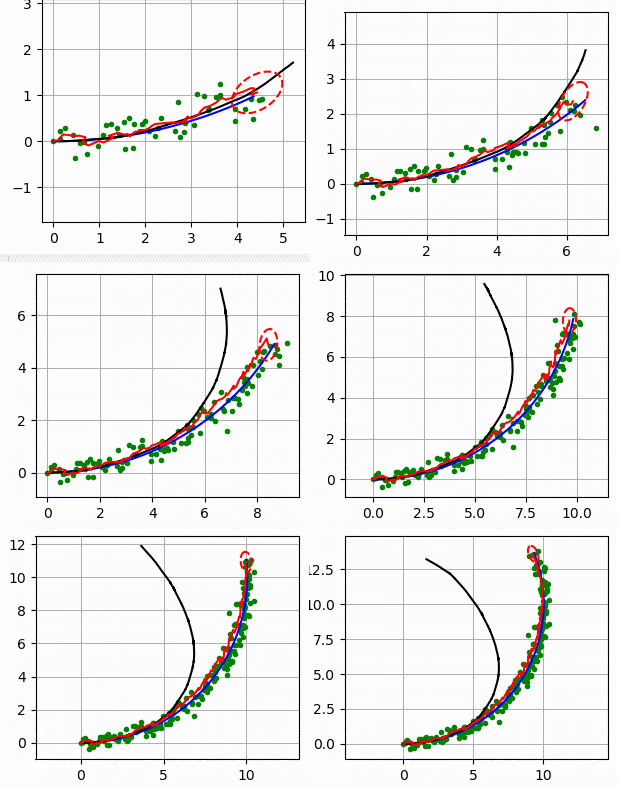
다음 그림에서 파란 선은 실제 궤적이고, 검은 선은 추측 항법 dead reckoning으로 계산한 궤적입니다..
녹색 점은 GPS로 관측한 값이고 빨간 선은 EKF로 추종한 궤적이 됩니다.
빨간 타원은 EKF의 추정 공분산이 됩니다.

필터 설계
이 시뮬레이션에서는 로봇은 시간 t에 대개 4개의 상태 벡터를 가지고 있습니다.
x, y는 2차원 상 x-y 좌표이며,
$\phi$는 방위, v는 속도를 의미합니다.
이 코드 상에서
xEst는 상태 벡터를 의미하며
$P_t$는 이 상태의 공분산 행렬
Q는 동작 노이즈의 공분산 행렬
R은 시간 t에 대한 측정 노이즈의 공분산 행렬이 됩니다.
로봇은 속도와 자이로 센서를 가지고 있으며
입력 벡터는 각 시간에 대해 다음과 같습니다.
그리고 로봇은 GNSS 센서를 가지고 있어 매 시간마다 x-y상 위치를 알수 있습니다.

이러한 입력과 관측 벡터는 센서 노이즈를 가지고 있는데
코드 상에서 observation 함수는 입력과 관측 벡터에 대해 노이즈를 추가하는 역활을 합니다.

동작 모델 Motion model
다음은 로봇 모델로

이에 따라 동작 모델은 다음과 같습니다.

여기서 dt는 시간 주기를 의미합니다.
이에 대한 자코비안 행렬은 다음과 같습니다.

관측 모델 Observation Model
로봇은 GPS로부터 x-y 위치 정보를 받으므로
GPS 관측 모델은 다음과 같습니다.

이에 대한 자코비안 행렬은

확장 칼만 필터
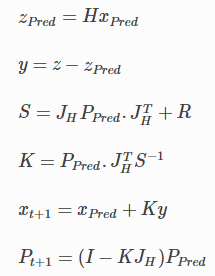
확장 칼만 필터를 이용한 위치 추정 과정을 정리하면
-- 예측 과정 --

-- 갱신 과정 --

"""
Extended kalman filter (EKF) localization sample
author: Atsushi Sakai (@Atsushi_twi)
"""

import math

import matplotlib.pyplot as plt
import numpy as np

# Covariance for EKF simulation
Q = np.diag([
    0.1,  # variance of location on x-axis
    0.1,  # variance of location on y-axis
    np.deg2rad(1.0),  # variance of yaw angle
    1.0  # variance of velocity
]) ** 2  # predict state covariance
R = np.diag([1.0, 1.0]) ** 2  # Observation x,y position covariance

#  Simulation parameter
INPUT_NOISE = np.diag([1.0, np.deg2rad(30.0)]) ** 2
GPS_NOISE = np.diag([0.5, 0.5]) ** 2

DT = 0.1  # time tick [s]
SIM_TIME = 20.0  # simulation time [s]

show_animation = True


def calc_input():
    v = 1.0  # [m/s]
    yawrate = 0.1  # [rad/s]
    u = np.array([[v], [yawrate]])
    return u


def observation(xTrue, xd, u):
    xTrue = motion_model(xTrue, u)

    # add noise to gps x-y
    z = observation_model(xTrue) + GPS_NOISE @ np.random.randn(2, 1)

    # add noise to input
    ud = u + INPUT_NOISE @ np.random.randn(2, 1)

    xd = motion_model(xd, ud)

    return xTrue, z, xd, ud


def motion_model(x, u):
    F = np.array([[1.0, 0, 0, 0],
                  [0, 1.0, 0, 0],
                  [0, 0, 1.0, 0],
                  [0, 0, 0, 0]])

    B = np.array([[DT * math.cos(x[2, 0]), 0],
                  [DT * math.sin(x[2, 0]), 0],
                  [0.0, DT],
                  [1.0, 0.0]])

    x = F @ x + B @ u

    return x


def observation_model(x):
    H = np.array([
        [1, 0, 0, 0],
        [0, 1, 0, 0]
    ])

    z = H @ x

    return z


def jacob_f(x, u):
    """
    Jacobian of Motion Model
    motion model
    x_{t+1} = x_t+v*dt*cos(yaw)
    y_{t+1} = y_t+v*dt*sin(yaw)
    yaw_{t+1} = yaw_t+omega*dt
    v_{t+1} = v{t}
    so
    dx/dyaw = -v*dt*sin(yaw)
    dx/dv = dt*cos(yaw)
    dy/dyaw = v*dt*cos(yaw)
    dy/dv = dt*sin(yaw)
    """
    yaw = x[2, 0]
    v = u[0, 0]
    jF = np.array([
        [1.0, 0.0, -DT * v * math.sin(yaw), DT * math.cos(yaw)],
        [0.0, 1.0, DT * v * math.cos(yaw), DT * math.sin(yaw)],
        [0.0, 0.0, 1.0, 0.0],
        [0.0, 0.0, 0.0, 1.0]])

    return jF


def jacob_h():
    # Jacobian of Observation Model
    jH = np.array([
        [1, 0, 0, 0],
        [0, 1, 0, 0]
    ])

    return jH


def ekf_estimation(xEst, PEst, z, u):
    #  Predict
    xPred = motion_model(xEst, u)
    jF = jacob_f(xEst, u)
    PPred = jF @ PEst @ jF.T + Q

    #  Update
    jH = jacob_h()
    zPred = observation_model(xPred)
    y = z - zPred
    S = jH @ PPred @ jH.T + R
    K = PPred @ jH.T @ np.linalg.inv(S)
    xEst = xPred + K @ y
    PEst = (np.eye(len(xEst)) - K @ jH) @ PPred
    return xEst, PEst


def plot_covariance_ellipse(xEst, PEst):  # pragma: no cover
    Pxy = PEst[0:2, 0:2]
    eigval, eigvec = np.linalg.eig(Pxy)

    if eigval[0] >= eigval[1]:
        bigind = 0
        smallind = 1
    else:
        bigind = 1
        smallind = 0

    t = np.arange(0, 2 * math.pi + 0.1, 0.1)
    a = math.sqrt(eigval[bigind])
    b = math.sqrt(eigval[smallind])
    x = [a * math.cos(it) for it in t]
    y = [b * math.sin(it) for it in t]
    angle = math.atan2(eigvec[bigind, 1], eigvec[bigind, 0])
    rot = np.array([[math.cos(angle), math.sin(angle)],
                    [-math.sin(angle), math.cos(angle)]])
    fx = rot @ (np.array([x, y]))
    px = np.array(fx[0, :] + xEst[0, 0]).flatten()
    py = np.array(fx[1, :] + xEst[1, 0]).flatten()
    plt.plot(px, py, "--r")


def main():
    time = 0.0

    # State Vector [x y yaw v]'
    xEst = np.zeros((4, 1))
    xTrue = np.zeros((4, 1))
    PEst = np.eye(4)

    xDR = np.zeros((4, 1))  # Dead reckoning

    # history
    hxEst = xEst
    hxTrue = xTrue
    hxDR = xTrue
    hz = np.zeros((2, 1))

    while SIM_TIME >= time:
        time += DT
        u = calc_input()

        xTrue, z, xDR, ud = observation(xTrue, xDR, u)

        xEst, PEst = ekf_estimation(xEst, PEst, z, ud)

        # store data history
        hxEst = np.hstack((hxEst, xEst))
        hxDR = np.hstack((hxDR, xDR))
        hxTrue = np.hstack((hxTrue, xTrue))
        hz = np.hstack((hz, z))

        if show_animation:
            plt.cla()
            # for stopping simulation with the esc key.
            plt.gcf().canvas.mpl_connect('key_release_event',
                    lambda event: [exit(0) if event.key == 'escape' else None])
            plt.plot(hz[0, :], hz[1, :], ".g")
            plt.plot(hxTrue[0, :].flatten(),
                     hxTrue[1, :].flatten(), "-b")
            plt.plot(hxDR[0, :].flatten(),
                     hxDR[1, :].flatten(), "-k")
            plt.plot(hxEst[0, :].flatten(),
                     hxEst[1, :].flatten(), "-r")
            plot_covariance_ellipse(xEst, PEst)
            plt.axis("equal")
            plt.grid(True)
            plt.pause(0.001)


if __name__ == '__main__':
    main()
'로봇 > 로봇' 카테고리의 다른 글
| 파이썬 로보틱스 - 위치추정, 파티클 필터 (0) | 2020.06.20 |
|---|---|
| 칼만, 베이즈 필터 - 파티클 필터 개요와 몬테카를로 방법 (0) | 2020.06.20 |
| 칼만과 베이즈 필터 in python (0) | 2020.06.19 |
| 파이썬 로보틱스 - 칼만 필터 기초 파트 2 (0) | 2020.06.19 |
| 파이썬 로보틱스 - 칼만 필터 기초 파트 1 (0) | 2020.06.18 |