이미지 그라디언트를 마치고 허프 변환을 어떻게 구현할까 생각해보고 있었는데,
opencv를보니 에지 영상에서 허프 변환을 수행했었다.
그런데 내가 만든 이미지 그라디언트는 커널 사이즈도 3 x 3으로 고정되어 있고,
그렇게 좋은 이미지들을 만드는것 같지는 않아보였다.
그래서
이미지 그라디언트 구현을 공부하면서 조금 연습했으니
이번에는 opencv 문서를 보면서 캐니 에지 검출기를 구현해 보려고 한다.
ref
docs.opencv.org/master/da/d22/tutorial_py_canny.html
캐니 에지 검출기 canny edge detector
- 존 F 캐니가 만든 많이 쓰이는 에지 검출기
- 아래의 단계로 구성
캐니 에지 검출기 구성 단계
1. 노이즈 제거
- 에지 검출기는 노이즈에 강인해야 한다. 그러니 우선 5 x 5 가우시안 필터로 노이즈를 제거하자.
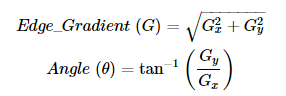
2. 이미지 그라디언트 강도, 방향 구하기
- 이미지를 가우시안 필터로 블러링 해주고 나서, 소벨 커널로 수평, 수직 방향으로 필터링해서 그라디언트 구하기
- 이미지 그라디언트를 연산해서 에지 그라디언트 강도와 방향을 구해주자.
* 그라디언트 방향은 에지에 수직.
* 에지 방향 각도는 아래의 식으로 구한 후 반올림을 하여 (0, 45, 90, 135도) 중 하나가 되도록 한다.
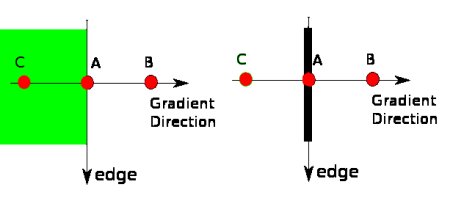
3. 비최대 억제 Non-maximu suppression
- 그라디언트 크기와 방향을 구했다면, 필요없는 픽셀들을 없앨 준비가 되었다.
- 그러려먼 우선 모든 픽셀들에 대해 에지 그라디언트 방향 부근의 픽셀들이 지역 최대치인지 확인하여야 한다.
- 아래 그림을 보면 점 A는 에지이고, 그라디언트 방향은 에지에 수직이며, 점 B와 C는 그라디언트 방향에 있다.
- 점 B와 C를 보고 A가 지역 최대점인지 판단한다. A가 지역 최대가 아니라면, 억제되어 0이 된다.
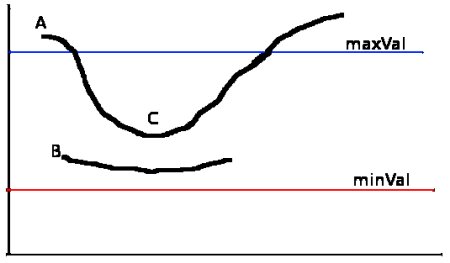
4. 이력 현상 임계화 hystersis thresholding(이력 현상 : 이전의 상태가 현재에 영향을 주는 현상)
- 이제 모든 에지들이 정말로 에지인지 아닌지 판단하기 위해서 두 임계값 minVal, maxVal이 필요하다.
- 그라디언트 강도가 max val보다 크면 에지이고, min val보다 작으면 에지가 아니라고 판단해서 버린다.
- 만약 임계치에 있는 경우에는 연결성을 고려해서 에지 여부를 판단한다.
- 아래의 에지 A는 maxVal보다 크니 확실히 에지로 보지만, 에지 C는 에지 A에 연결되었으니 에지로본다.
- 하지만 에지 B는 minVal보다 크고, 에지 C랑 같은 곳에 있지만 A랑 연결이 안되있으므로 에지가 아닌것으로 본다.
2020. 12. 1 1:50
- 위 이론 내용 정리 후 자료 찾아가면서 구현하다보니 늦어졌다.
- 코드 일부분, 시각화 결과를 우선 보인 후 전체 코드를 맨 뒤에다가 배치.
전체 구성
1. 기본 이미지 시각화
2. 가우시안 필터링 적용
3. 이미지 그라디언트 방향 영상, 그라디언트 크기 영상 시각화
4. 비최대 억제 결과 시각화
5. 이력 현상 임계화 추가 -> 캐니 에지 검출기 완성
6. 캐니 에지 검출 과정 모든 이미지 시각화
7. 전체 코드
후기
- 기존의 opencv에서 제공하는 함수에 비하면 원하는 결과도 잘 나오지 않고, 속도도 매우 느린 편이다.
- 하지만 직접 수식, 개념들을 완전히는 아니더라도 조금씩 이해해 가면서 구현하는 과정이 좋았다.
- 이걸 하는 중간에 보니 내가 연결성 부분이나 범람 채움 알고리즘 같은 내용들을 넘어갔던것 같다. 내일 한번 봐야할듯.
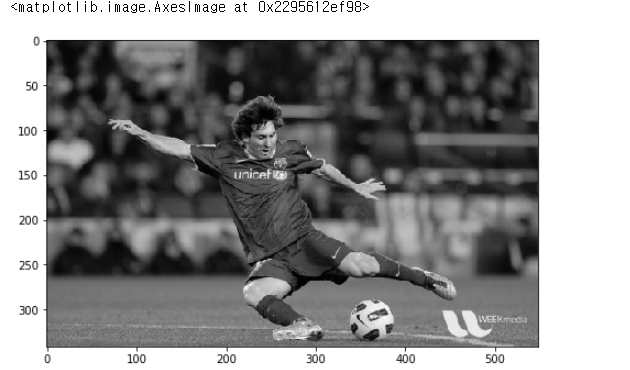
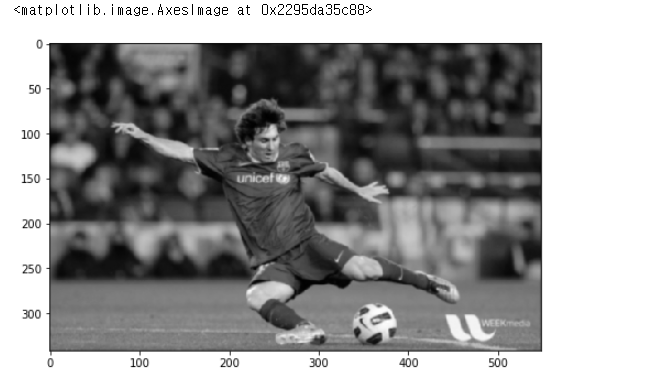
1. 기본 이미지 시각화
- opencv 예제에서 제공하는 기본 messi5.jpg
import numpy as np
import matplotlib.pyplot as plt
from utils import padding, gaussian_filtering
from PIL import Image
import cv2

plt.figure(figsize=(8,12))
img = Image.open("./res/messi5.jpg").convert("L")
img = np.asarray(img)
plt.imshow(img, cmap="gray")
2. 가우시안 필터링 적용
- opencv doc에서 kernel size가 5인 가우시안 커널을 사용한다고 한다. 시그마는 0.8로 지정
plt.figure(figsize=(8,12))
img_blur = gaussian_filtering(img,k_size=5, sigma=0.8)
plt.imshow(img_blur,cmap="gray")
3. 이미지 그라디언트 방향 영상, 그라디언트 크기 영상 시각화
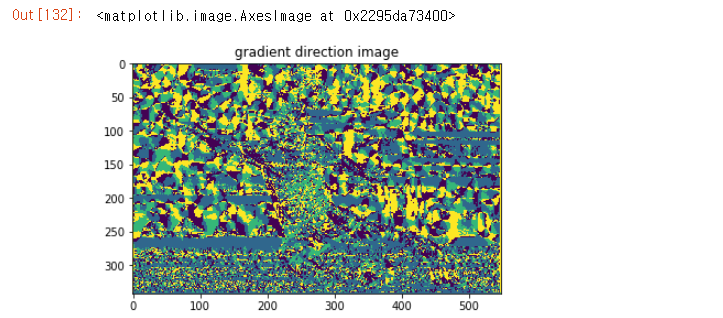
grad_intensity = get_gradient_intensity(img_blur)
plt.title("gradient direction image")
plt.imshow(grad_intensity[:,:,0])
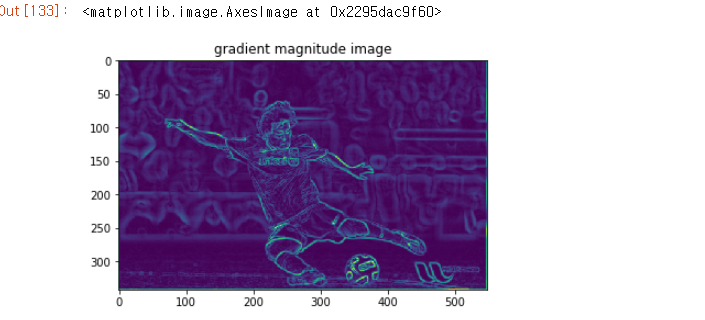
plt.title("gradient magnitude image")
plt.imshow(grad_intensity[:,:,1])
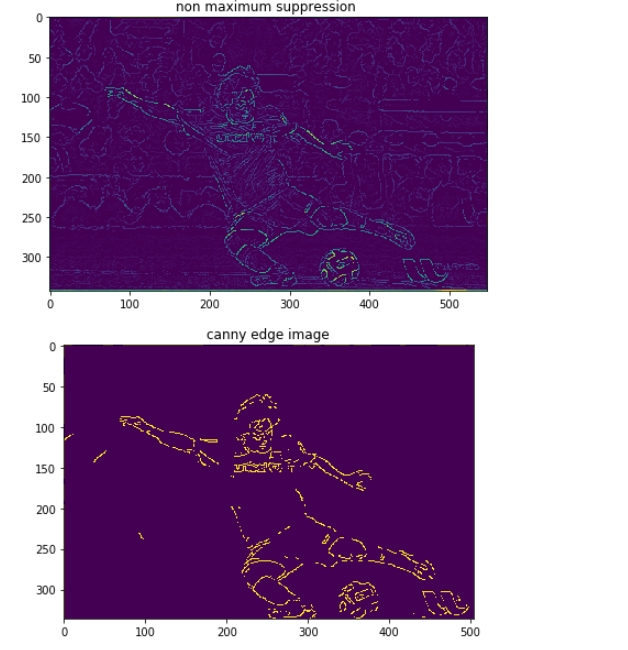
4. 비최대 억제 결과 시각화
- 그라디언드 방향에 존재하는 픽셀 세 개 비교.
- 중앙 픽셀이 가장 크면 나두고, 같은 방향 다른 픽셀이 크면 억제하여 0
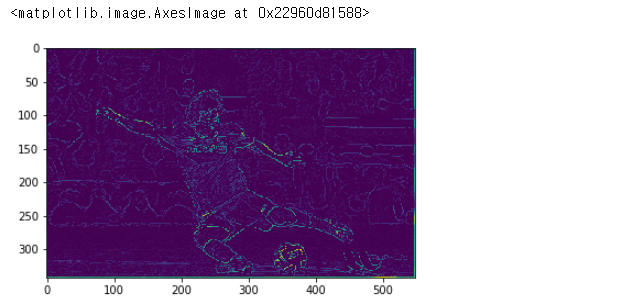
supressed_img = non_maximum_suppression(grad_intensity)
plt.imshow(supressed_img)
5. 이력 현상 임계화 추가 -> 캐니 에지 검출기 완성
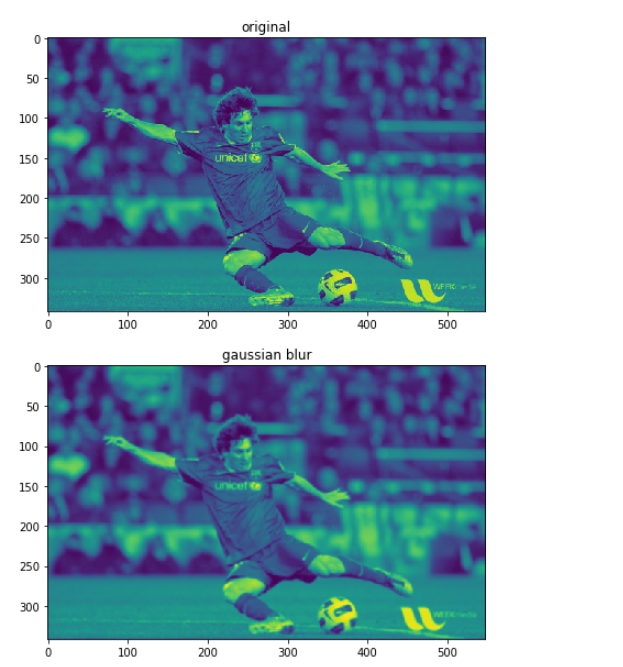
img = Image.open("./res/messi5.jpg").convert("L")
img = np.asarray(img)
img_blur = gaussian_filtering(img,k_size=5, sigma=1)
grad_intensity = get_gradient_intensity(img_blur)
suppressed_img = non_maximum_suppression(grad_intensity)
canny_edge = hysteresis_threshold(suppressed_img=suppressed_img,min_th=100, max_th=200)


plt.figure(figsize=(64,32))
plt.subplot(6, 1, 1)
plt.title("original")
plt.imshow(img)
plt.subplot(6, 1, 2)
plt.title("gaussian blur")
plt.imshow(img_blur)
plt.subplot(6, 1, 3)
plt.title("gradient direction")
plt.imshow(grad_intensity[:, :,0])
plt.subplot(6, 1, 4)
plt.title("gradient magnitude")
plt.imshow(grad_intensity[:, :,1])
plt.subplot(6, 1, 5)
plt.title("non maximum suppression ")
plt.imshow(suppressed_img)
plt.subplot(6, 1, 6)
plt.title("canny edge image")
plt.imshow(canny_edge)
6. 캐니 에지 검출 과정 모든 이미지 시각화
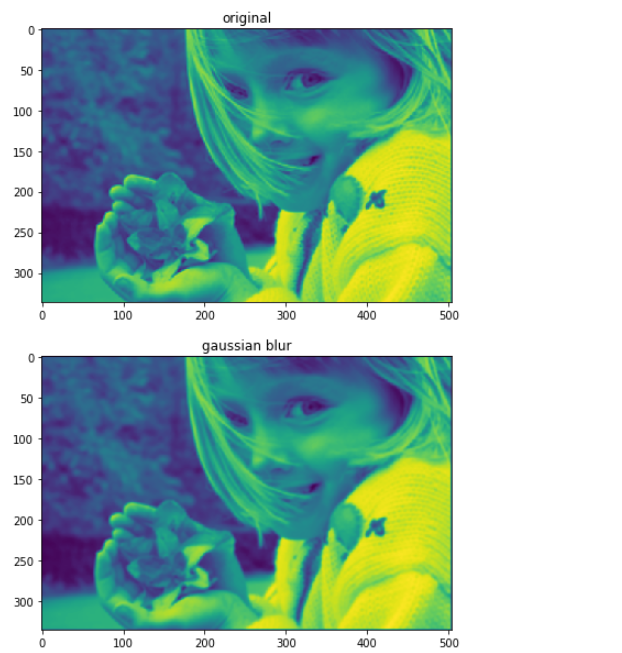
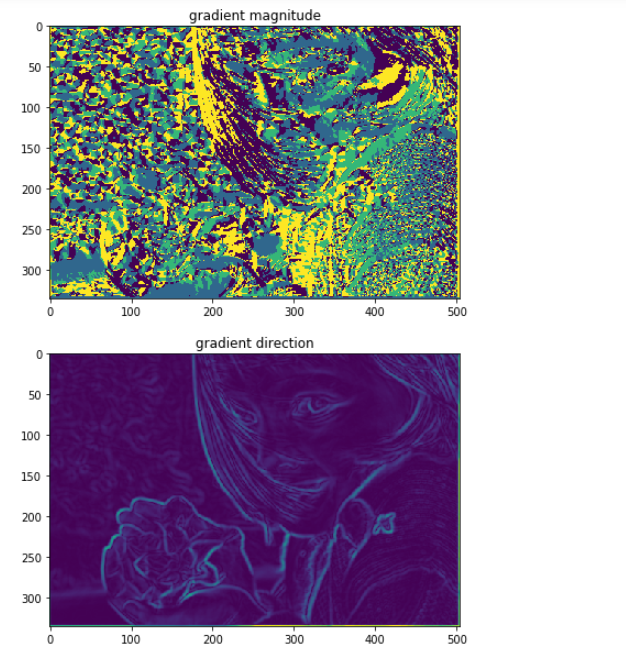
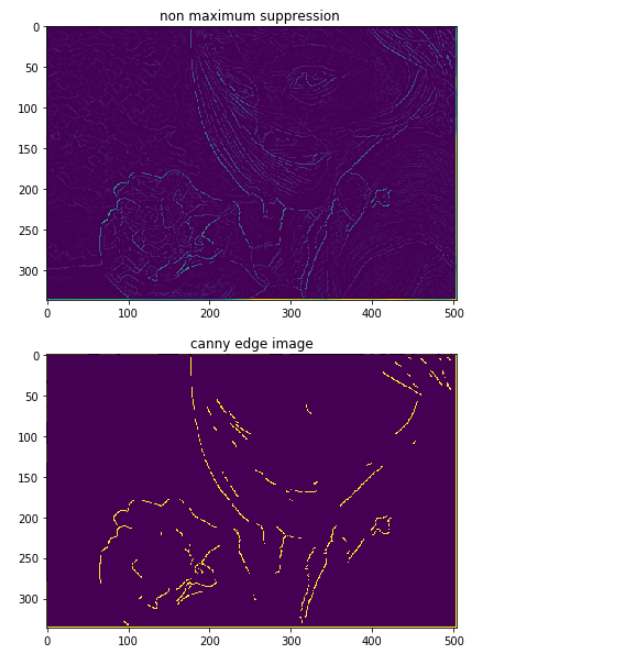
def canny_edge_visualize(img, min_th=100, max_th=200):
    """
    canny_edge_visualize
    - visualize all images from original to canny edge

    parameter
    - img : original image
    - min_th : minimal threshold value
    - max_th : maximum threshold value
    """
    img_blur = gaussian_filtering(img,k_size=5, sigma=1)
    grad_intensity = get_gradient_intensity(img_blur)
    suppressed_img = non_maximum_suppression(grad_intensity)
    canny_edge = hysteresis_threshold(suppressed_img=suppressed_img,min_th=100, max_th=200)

    plt.figure(figsize=(64,32))
    plt.subplot(6, 1, 1)
    plt.title("original")
    plt.imshow(img)
    plt.subplot(6, 1, 2)
    plt.title("gaussian blur")
    plt.imshow(img_blur)
    plt.subplot(6, 1, 3)
    plt.title("gradient magnitude")
    plt.imshow(grad_intensity[:, :,0])
    plt.subplot(6, 1, 4)
    plt.title("gradient direction")
    plt.imshow(grad_intensity[:, :,1])
    plt.subplot(6, 1, 5)
    plt.title("non maximum suppression ")
    plt.imshow(suppressed_img)
    plt.subplot(6, 1, 6)
    plt.title("canny edge image")
    plt.imshow(canny_edge)

img = Image.open("./res/kid.jpg").convert("L")
img = np.asarray(img)
canny_edge_visualize(img)
7. 전체 코드
"""
Canny Edge Detector
- 2020. 12.1 01:50

"""


"""
ref
- https://en.wikipedia.org/wiki/Canny_edge_detector
"""
def sobel_kerenl():
    kernel_x = np.array([
        [-1, 0, 1],
        [-2, 0, 2],
        [-1, 0, 1]
    ])
    kernel_y = np.array([
        [1, 2, 1],
        [0, 0, 0],
        [-1, -2, -1]
    ])
    return kernel_x, kernel_y

def get_rounded_gradient_angle(ang):
    """
    get_rounded_gradient_angle
    - gradient direction angle round to one of four angles

    return : one of four angles
            representing vertical, horizontal and two diagonal direction

    parameteres
    ---------------
    ang : gradient direction angle
    """
    vals = [0, np.pi*1/4, np.pi*2/4, np.pi*3/4, np.pi*4/4]
    interval = [np.pi*1/8, np.pi*3/8, np.pi * 5/8, np.pi* 7/8]

    if ang < interval[0] and ang >= interval[-1]:
        ang = vals[0]
    elif ang < interval[1] and ang >= interval[0]:
        ang = vals[1]
    elif ang < interval[2] and ang >= interval[1]:
        ang = vals[2]
    elif ang < interval[3] and ang >= interval[2]:
        ang = vals[3]
    else:
        ang = vals[4]
    return ang


def get_gradient_intensity(img):
    """
    get gradient_intensity
    - calculate gradient direction and magnitude

    return (rows, cols, 2) shape of image about grad direction and mag

    parameteres
    ------------
    img : blured image
    """
    k_size = 3
    rows, cols = img.shape
    kernel_x, kernel_y = sobel_kerenl()
    pad_img = padding(img, k_size=k_size)
    res = np.zeros((rows, cols, 2))
    sx, sy = 0, 0

    for i in range(0, rows):
        for j in range(0, cols):
            boundary = pad_img[i:i+k_size, j:j+k_size]
            sx = np.sum(kernel_x * boundary)
            sy = np.sum(kernel_y * boundary)
            ang = np.arctan2(sy, sx)
            mag = abs(sx) + abs(sy)
            if ang < 0:
                ang = ang + np.pi
            ang = get_rounded_gradient_angle(ang)
            res[i, j, 0] = ang
            res[i, j, 1] = mag
    return res


def check_local_maximum(direction=None, boundary=None):
    """
    check_local_maximum
    - check if center value is local maximum depend on gradient direction
    return True if center valus is local maximum

    parameter
    ------------
    direction : gradient direction
    boundary : region of image for finding local maximum
    """
    if direction == 0: # 0 degree, east and west direction
        kernel = np.array([
            [0, 0, 0],
            [1, 1, 1],
            [0, 0, 0]
        ])

    elif direction == 1: #45 degree, north east and south west direction
        kernel = np.array([
            [0, 0, 1],
            [0, 1, 0],
            [1, 0, 0]
        ])
    elif direction == 2: #90 degree, north & south direction
        kernel = np.array([
            [0, 1, 0],
            [0, 1, 0],
            [0, 1, 0]
        ])
    else : #135 degree, north west & south east direction
        kernel = np.array([
            [1, 0, 0],
            [0, 1, 0],
            [0, 0, 1]
        ])

    max_val = np.max(kernel * boundary)
    if boundary[1,1] == max_val: #local maximum
        return True
    else: # not local maximu
        return False


def non_maximum_suppression(grad_intensity=grad_intensity):
    """
    non_maximum_suppression
    - check a pixel wiht it's neighbors in the direction of gradient
    - if a pixel is not local maximum, it is suppressed(means to be zero)
    """
    directions = [0, np.pi*1/4, np.pi*2/4, np.pi*3/4, np.pi*4/4]

    k_size = 3
    grad_direction = grad_intensity[:, :, 0]
    grad_magnitude = grad_intensity[:, :, 1]

    rows, cols = grad_magnitude.shape
    pad_img = padding(grad_magnitude, k_size=k_size)
    res_img = np.zeros((rows,cols))
    sx, sy = 0, 0


    for i in range(0, rows):
        for j in range(0, cols):
            direction = directions.index(grad_direction[i,j])
            boundary = pad_img[i:i+k_size, j:j+k_size]
            if check_local_maximum(direction, boundary) == True:
                res_img[i, j] = grad_magnitude[i, j]
            else:
                res_img[i, j] = 0
    return res_img


def hysteresis_threshold(suppressed_img=None, min_th=None, max_th=None):
    """
    hysterisis_threshold
    - check edge is connected to strong edge using eight connectivity

    parameter
    ---------------------
    - suppressed img : non maximum suppressed image
    - min_th : minimal threshold value
    - max_th : maximum threshold value
    """
    k_size = 3
    rows, cols = supressed_img.shape
    pad_img = padding(suppressed_img, k_size=k_size)
    res_img = np.zeros((rows,cols))

    eight_connectivity = np.array([
        [1, 1, 1],
        [1, 0, 1],
        [1, 1, 1]
    ])

    for i in range(0, rows):
        for j in range(0, cols):
            if pad_img[i+1, j+1] < min_th:
                res_img[i, j] = 0
            else:
                boundary = pad_img[i:i+k_size, j:j+k_size]
                max_magnitude = np.max(boundary * eight_connectivity)
                if max_magnitude >= max_th : # pixel is connected to real edge
                    res_img[i, j] = 255
                else:
                    res_img[i, j] = 0
    return res_img


def canny_edge_detector(img=None, min_th=None, max_th=None):
    """
    canny_edge_detector
    - detect canny edge from original image

    parameter
    - img : original image
    - min_th : minimal threshold value
    - max_th : maximum threshold value
    """
    img_blur = gaussian_filtering(img,k_size=5, sigma=1)
    grad_intensity = get_gradient_intensity(img_blur)
    suppressed_img = non_maximum_suppression(grad_intensity)
    canny_edge = hysteresis_threshold(suppressed_img=suppressed_img,
                                      min_th=min_th, max_th=max_th)
    return canny_edge


def canny_edge_visualize(img, min_th=100, max_th=200):
    """
    canny_edge_visualize
    - visualize all images from original to canny edge

    parameter
    - min_th : minimal threshold value
    - max_th : maximum threshold value
    """
    img_blur = gaussian_filtering(img,k_size=5, sigma=1)
    grad_intensity = get_gradient_intensity(img_blur)
    suppressed_img = non_maximum_suppression(grad_intensity)
    canny_edge = hysteresis_threshold(suppressed_img=suppressed_img,min_th=100, max_th=200)

    plt.figure(figsize=(64,32))
    plt.subplot(6, 1, 1)
    plt.title("original")
    plt.imshow(img)
    plt.subplot(6, 1, 2)
    plt.title("gaussian blur")
    plt.imshow(img_blur)
    plt.subplot(6, 1, 3)
    plt.title("gradient magnitude")
    plt.imshow(grad_intensity[:, :,0])
    plt.subplot(6, 1, 4)
    plt.title("gradient direction")
    plt.imshow(grad_intensity[:, :,1])
    plt.subplot(6, 1, 5)
    plt.title("non maximum suppression ")
    plt.imshow(suppressed_img)
    plt.subplot(6, 1, 6)
    plt.title("canny edge image")
    plt.imshow(canny_edge)
'로봇 > 영상' 카테고리의 다른 글
| 컴퓨터 비전 알고리즘 구현 - 12. 허프 변환을 이용한 직선 검출 구현 (0) | 2020.12.05 |
|---|---|
| 컴퓨터 비전 알고리즘 구현 - 11. 허프 변환 (0) | 2020.12.03 |
| 컴퓨터 비전 알고리즘 구현 - 9. 이미지 그라디언트 (0) | 2020.11.30 |
| 컴퓨터 비전 알고리즘 구현 - 8. 모폴로지 연산 (0) | 2020.11.30 |
| 컴퓨터 비전 알고리즘 구현 - 7. 가우시안 스무딩 (0) | 2020.11.30 |