728x90
가장 단순한 plt.subplots()
여러개 플롯 생성 없이 사용.
import numpy as np
import matplotlib.pyplot as plt

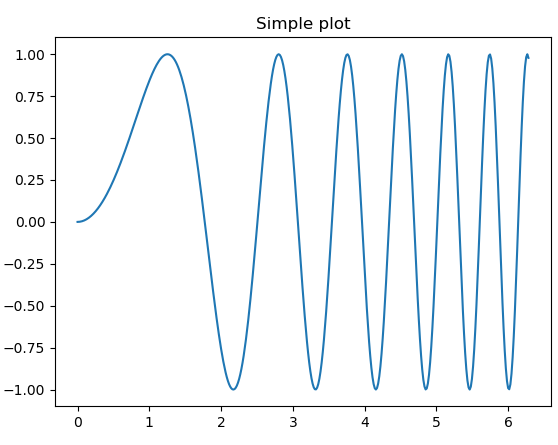
x = np.linspace(0, 2*np.pi, 400)
y = np.sin(x**2)

# Create just a figure and only one subplot
fig, ax = plt.subplots()
ax.plot(x, y)
ax.set_title('Simple plot')

plt.show()
300x250
'컴퓨터과학 > 기타' 카테고리의 다른 글
| 라즈베리파이 모니터 없이 wifi 설정, ssh 접속, vnc까지 (0) | 2020.08.29 |
|---|---|
| matplotlib - 2. 1x2, 2x2 subplots (0) | 2020.08.25 |
| openmp - 25. 테스크 데이터 유효범위와 피보나치 (0) | 2020.07.30 |
| openmp - 24. 테스크 (0) | 2020.07.30 |
| openmp - 23. 스캐줄링과 만델브로트 (0) | 2020.07.30 |