728x90
1. 흑백 이미지 히스토그램 출력
import cv2
import numpy as np
from matplotlib import pyplot as plt

img = cv2.imread('C:/Users/do/Documents/github/opencv_python/res/home.jpg',0)

plt.subplot(121),plt.imshow(img, cmap="gray")
plt.subplot(122),plt.hist(img.ravel(),256,[0,256]);

plt.show()

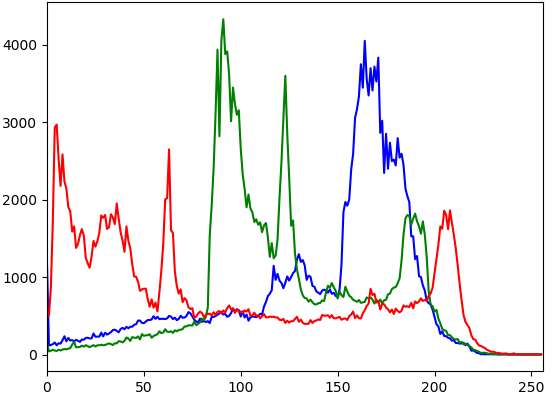
2. 컬러 이미지 히스토그램 출력
import cv2
import numpy as np
from matplotlib import pyplot as plt

img = cv2.imread('C:/Users/do/Documents/github/opencv_python/res/home.jpg')


color = ('b','g','r')
for i,col in enumerate(color):
    histr = cv2.calcHist([img],[i],None,[256],[0,256])
    plt.plot(histr,color = col)
    plt.xlim([0,256])
plt.show()

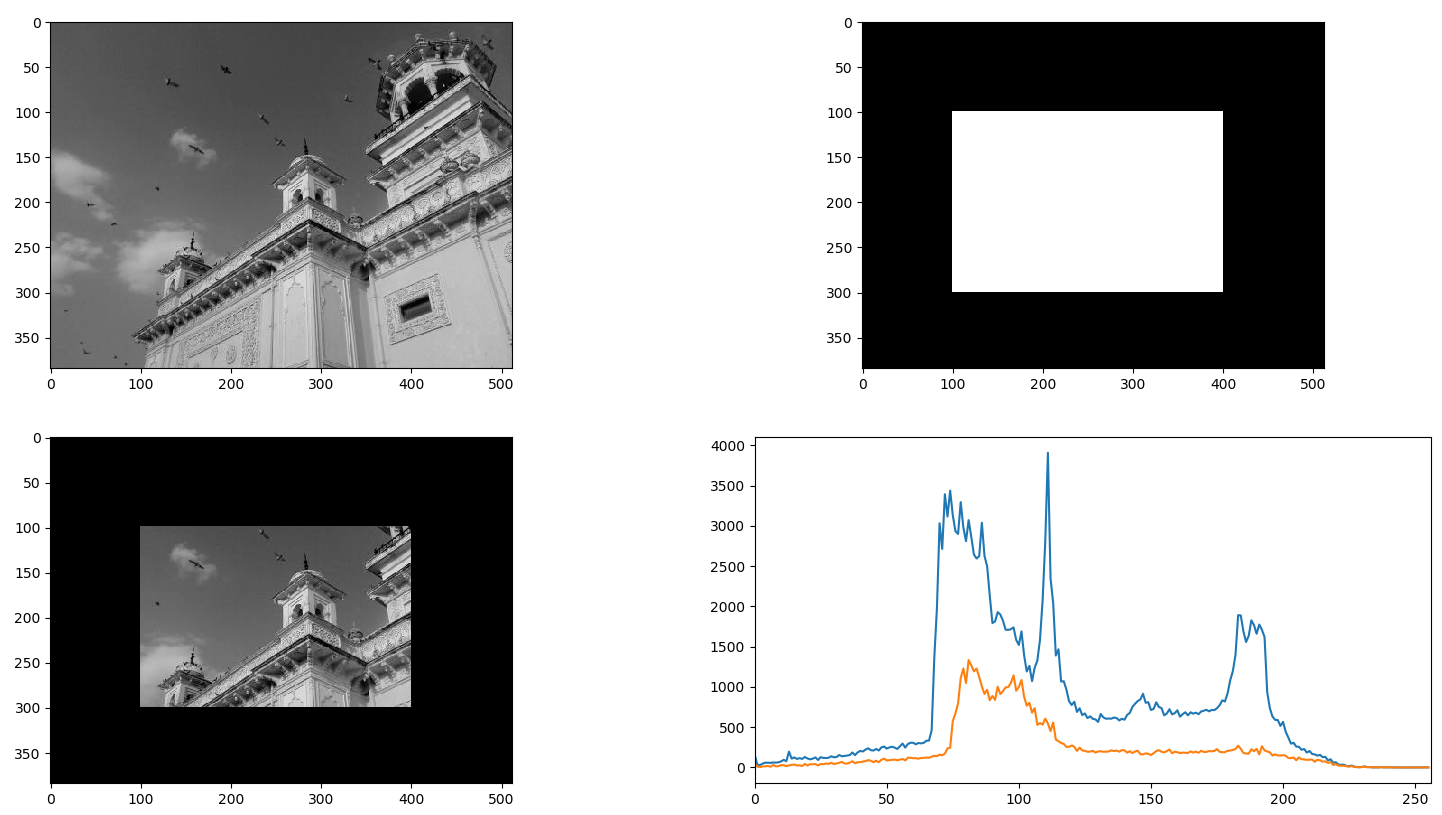
3. 비트와이즈 연산으로 마스킹
import cv2
import numpy as np
from matplotlib import pyplot as plt

img = cv2.imread('C:/Users/do/Documents/github/opencv_python/res/home.jpg',0)

# create a mask
mask = np.zeros(img.shape[:2], np.uint8)
mask[100:300, 100:400] = 255
masked_img = cv2.bitwise_and(img,img,mask = mask)

# Calculate histogram with mask and without mask
# Check third argument for mask
hist_full = cv2.calcHist([img],[0],None,[256],[0,256])
hist_mask = cv2.calcHist([img],[0],mask,[256],[0,256])

plt.subplot(221), plt.imshow(img, 'gray')
plt.subplot(222), plt.imshow(mask,'gray')
plt.subplot(223), plt.imshow(masked_img, 'gray')
plt.subplot(224), plt.plot(hist_full), plt.plot(hist_mask)
plt.xlim([0,256])

plt.show()

300x250
'로봇 > 영상' 카테고리의 다른 글
| opencv-python 튜토리얼 - 17. 탬플릿 매칭 (0) | 2020.08.15 |
|---|---|
| opencv-python 튜토리얼 - 16. 푸리에 변환 (1) | 2020.08.15 |
| opencv-python 튜토리얼 - 14. 이미지 피라미드 (0) | 2020.08.15 |
| opencv-python 튜토리얼 - 13. 캐니 에지 검출기 (0) | 2020.08.14 |
| opencv-python 튜토리얼 - 12. 이미지 그라디언트 (0) | 2020.08.14 |