목표
-단순 이진화, 적응적 이진화, 오츠 이진화
단순 이진화
- 이진화는 간단하게 임계값보다 크다면 1, 아니면 0을 주는 간단한 문제
-> cv2.thresold 함수 사용. 명암영상만 가능
- 둘째 매개변수는 이진화에 사용할 임계값.
- 3번째 매개변수는 픽셀의 최대값
- 냇쨰 파라미터로 아래와 같은 것들이 있음.
cv2.THRESH_BINARY
cv2.THRESH_BINARY_INV
cv2.THRESH_TRUNC
cv2.THRESH_TOZERO
cv2.THRESH_TOZERO_INV
import cv2
import numpy as np
from matplotlib import pyplot as plt

img = cv2.imread('C:/Users/do/Documents/github/opencv_python/res/gradient.png',0)
ret,thresh1 = cv2.threshold(img,127,255,cv2.THRESH_BINARY)
ret,thresh2 = cv2.threshold(img,127,255,cv2.THRESH_BINARY_INV)
ret,thresh3 = cv2.threshold(img,127,255,cv2.THRESH_TRUNC)
ret,thresh4 = cv2.threshold(img,127,255,cv2.THRESH_TOZERO)
ret,thresh5 = cv2.threshold(img,127,255,cv2.THRESH_TOZERO_INV)

titles = ['Original Image','BINARY','BINARY_INV','TRUNC','TOZERO','TOZERO_INV']
images = [img, thresh1, thresh2, thresh3, thresh4, thresh5]

for i in xrange(6):
    plt.subplot(2,3,i+1),plt.imshow(images[i],'gray')
    plt.title(titles[i])
    plt.xticks([]),plt.yticks([])

plt.show()
1. 원본 영상
2. 이진화 : 명암값 127 기준으로
3. 역이진화 : 127보다 작으면 1
4. truc : 127보다 작으면 0
...

적응적 이진화
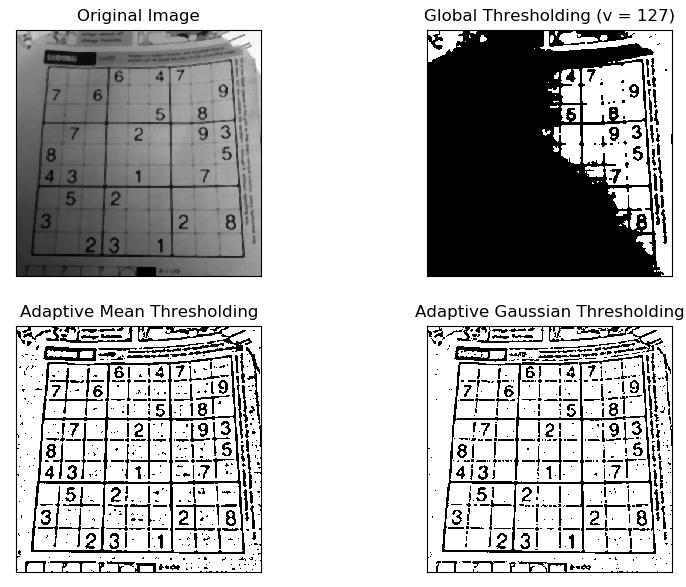
- 조금전 예제에선 임계치값을 지정해줌
- 빛이 비쳐 그늘 생긴 이미지에선 안좋음 -> 적응적 이진화 사용
- 영상 일부분을 서로 다른 이진화 값 사용 -> 모든 영역에 다른 이진화 값을 적용하여 조명 변화시에도 좋은 결과 나옴
적응적 이진화 파라미터
- 적응화 방법
cv2.ADAPTIVE_THRESH_MEAN_C : 주위 영역의 평균값을 임계치로 사용
cv2.ADAPTIVE_THRSH_GAUSSIAN_C : 가우시안 윈도우로 주위 픽셀들의 가중치 합을 임계치로 사용
- BLOCK SIZE : 주변 공간 크기
- C : 상수로 평균과 가중치에서 얼마만큼 -할지 지정하는값
* 반환값 ret은 나중에 설명
import cv2
import numpy as np
from matplotlib import pyplot as plt

img = cv2.imread('C:/Users/do/Documents/github/opencv_python/res/dave.jpg',0)
img = cv2.medianBlur(img,5)

ret,th1 = cv2.threshold(img,127,255,cv2.THRESH_BINARY)
th2 = cv2.adaptiveThreshold(img,255,cv2.ADAPTIVE_THRESH_MEAN_C,\
            cv2.THRESH_BINARY,11,2)
th3 = cv2.adaptiveThreshold(img,255,cv2.ADAPTIVE_THRESH_GAUSSIAN_C,\
            cv2.THRESH_BINARY,11,2)

titles = ['Original Image', 'Global Thresholding (v = 127)',
            'Adaptive Mean Thresholding', 'Adaptive Gaussian Thresholding']
images = [img, th1, th2, th3]

for i in range(4):
    plt.subplot(2,2,i+1),plt.imshow(images[i],'gray')
    plt.title(titles[i])
    plt.xticks([]),plt.yticks([])
plt.show()

오츠 이진화
- 이전에 살펴본 전역적인 이진화에선 특정한 임계값을 사용
=> 이 임계값이 좋은지 나쁜지 알려면 시행착오(trial and error)를 해야함
- 하지만 양봉 이미지(히스토그램상 봉우리가 2개인) 경우를 생각해보면 양 봉우리의 평균을 근사해서 임계치를 사용해야함 -> 오츠 이진화가 수행
=> 이미지 히스토그램으로 자동으로 임계치 계산 해줌
오츠 이진화 코드
- cv2.threshold() 함수를 사용. 플래그 cv2.THRESH_OTS 추가. 임계값은 0으로 설정
- 다음 예시에서 노이즈 영상 사용
- 1번째 케이스는 전역 임계치를 127로 설정
- 2번째는 오츠 이진화를 바로 수행
- 셋째는 5 x5 가우시안 커널로 노이즈 제거후 오츠 이진화 수행
import cv2
import numpy as np
from matplotlib import pyplot as plt

img = cv2.imread('C:/Users/do/Documents/github/opencv_python/res/noisy2.png',0)

# global thresholding
ret1,th1 = cv2.threshold(img,127,255,cv2.THRESH_BINARY)

# Otsu's thresholding
ret2,th2 = cv2.threshold(img,0,255,cv2.THRESH_BINARY+cv2.THRESH_OTSU)

# Otsu's thresholding after Gaussian filtering
blur = cv2.GaussianBlur(img,(5,5),0)
ret3,th3 = cv2.threshold(blur,0,255,cv2.THRESH_BINARY+cv2.THRESH_OTSU)

# plot all the images and their histograms
images = [img, 0, th1,
          img, 0, th2,
          blur, 0, th3]
titles = ['Original Noisy Image','Histogram','Global Thresholding (v=127)',
          'Original Noisy Image','Histogram',"Otsu's Thresholding",
          'Gaussian filtered Image','Histogram',"Otsu's Thresholding"]

for i in range(3):
    plt.subplot(3,3,i*3+1),plt.imshow(images[i*3],'gray')
    plt.title(titles[i*3]), plt.xticks([]), plt.yticks([])
    plt.subplot(3,3,i*3+2),plt.hist(images[i*3].ravel(),256)
    plt.title(titles[i*3+1]), plt.xticks([]), plt.yticks([])
    plt.subplot(3,3,i*3+3),plt.imshow(images[i*3+2],'gray')
    plt.title(titles[i*3+2]), plt.xticks([]), plt.yticks([])
plt.show()

오츠 이진화 동작 방법
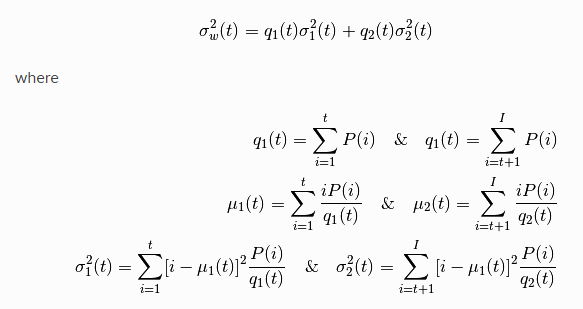
- 양봉 이미지에서 오츠 이진화를 수행할떄, 오츠 알고리즘은 두 가중화된 클래스의 분산을 최소화 하는 임계치를 찾음

=> 두 클래스의 분산이 최소가 되는 값 t를 찾게됨
- 위 식을 아래와 같이 구현할 수 있다.
import cv2
import numpy as np
from matplotlib import pyplot as plt

img = cv2.imread('C:/Users/do/Documents/github/opencv_python/res/noisy2.png',0)
blur = cv2.GaussianBlur(img,(5,5),0)

# find normalized_histogram, and its cumulative distribution function
hist = cv2.calcHist([blur],[0],None,[256],[0,256])
hist_norm = hist.ravel()/hist.max()
Q = hist_norm.cumsum()

bins = np.arange(256)

fn_min = np.inf
thresh = -1

for i in range(1,256):
    p1,p2 = np.hsplit(hist_norm,[i]) # probabilities
    q1,q2 = Q[i],Q[255]-Q[i] # cum sum of classes
    b1,b2 = np.hsplit(bins,[i]) # weights

    # finding means and variances
    m1,m2 = np.sum(p1*b1)/q1, np.sum(p2*b2)/q2
    v1,v2 = np.sum(((b1-m1)**2)*p1)/q1,np.sum(((b2-m2)**2)*p2)/q2

    # calculates the minimization function
    fn = v1*q1 + v2*q2
    if fn < fn_min:
        fn_min = fn
        thresh = i

# find otsu's threshold value with OpenCV function
ret, otsu = cv2.threshold(blur,0,255,cv2.THRESH_BINARY+cv2.THRESH_OTSU)
print(thresh)
print(ret)
오츠 이진화 알고리즘 수행과정
- 수식

1. 이미지 읽고 블러링

2. 히스토그램을 구하고, 정규화 후 누적 확률 분포(위 식에서 q) 얻기

3. 이진화 구간, 파라미터 설정

4. i 값에 따라 정규화 히스토그램, 누적합, 이진화 구간 분리

5. 4에서 구한 확률들과 두 클래스의 누적확률분포, 이진화 구간(가중치로 사용)으로 기대값 계산


6. 오츠 임계화에 필요한 omega^2구하기
- [가중치(이진 구간) - 기대값]^2 * i일 확률 / 누적확률분포


7. 오츠 최소화 함수 계산
- 모든 픽셀에 대해 루프 돌면서, 비용 함수가 최소가 될때 오츠값(ft_min)과 임계치(thresh)를 구함


'로봇 > 영상' 카테고리의 다른 글
| opencv-python 튜토리얼 - 11. 모폴로지 연산 (0) | 2020.08.14 |
|---|---|
| opencv-python 튜토리얼 - 10. 이미지 스무딩 (0) | 2020.08.14 |
| opencv-python 튜토리얼 - 8. 이미지 기하학적 변환 (0) | 2020.08.13 |
| opencv-python 튜토리얼 - 7. 이미지 기본 연산 다루기 (0) | 2020.08.10 |
| opencv-python 튜토리얼 - 6. 트랙바를 컬러 팔레트로 사용해보기 (0) | 2020.08.10 |